The cartographic process for orienteering maps
Today, maps can be produced easily through a wide range of online tools by anyone with access to the Internet. Maps for the sport of orienteering are typically produced by orienteers who have acquired an expertise in mapping starting as orienteering novices, moving on, as their sporting competence develops, to setting courses and in the process finding that all maps need updating from time to time. Their interest in maps and map creation grows. Their next step is to use their new mapping skills to create maps. Without being aware they have joined the academic and professional field that focuses on mapping. The field is called “cartography.” Cartography has been defined by the International Cartographic Association as “the discipline dealing with the conception, production, dissemination and study of maps.” One useful conceptualisation of cartography is as a process that links map makers, map users, the environment mapped, and the map itself. One characterisation of this process is depicted in the following figure.
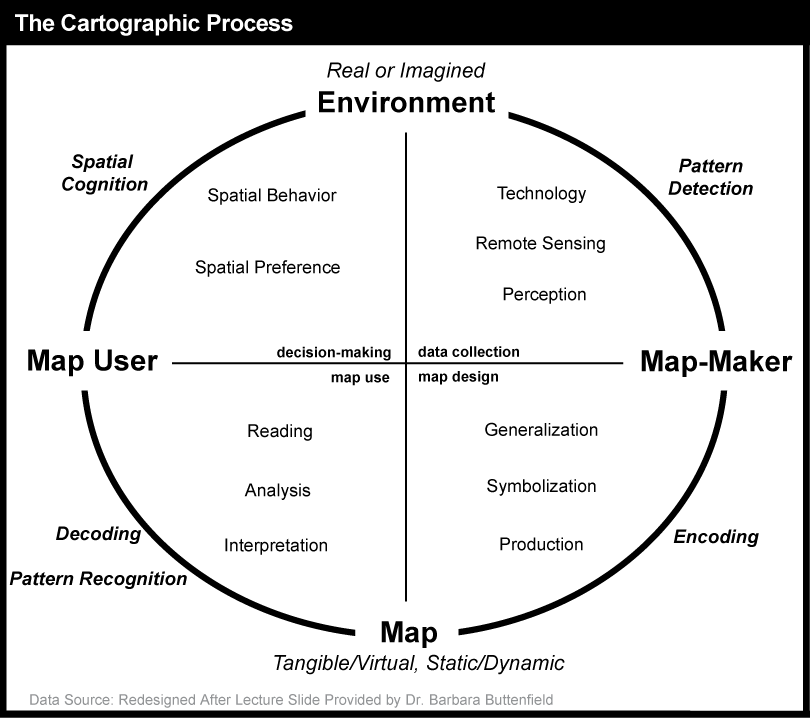
The cartographic process for orienteering is a cycle that begins with the discovery of an area that is suitable for an event.
As map makers collect data from the environment (through fieldwork, technology and/or remote sensing), they use their perception to detect patterns and subsequently prepare the data for map creation (i.e., they think about the data and its patterns as well as how to best visualise them on a map). Next, the map maker uses the data and attempts to signify it visually on a map (encoding), applying generalisation, symbolisation, and production methods that will (hopefully) lead to a depiction that can be interpreted by an orienteer (the map user) in the way the map maker intended (its purpose). Next, the orienteer reads, analyses, and interprets the map by decoding the symbols and recognising patterns. Finally, the orienteer (the map user) makes decisions and takes action based upon what they find in the map. Through their provision of a viewpoint on the world, maps influence our spatial behaviour and spatial preferences and shape how we view the environment.
In the cartographic process as outlined above, the fundamental component in generating a map to depict the environment is itself a process – the process of map abstraction.
Map Abstraction
Map abstraction is fundamental to representing entities in a legible manner. It involves leaving out much detail that is not essential to the use of the map by the orienteer. The process of map abstraction includes at least five major (interdependent) steps: (a) selection, (b) classification, (c) simplification, (d) exaggeration, and (e) symbolisation (ref: Muehrcke and Muehrcke, 1992).
Selection
Orienteering cartographers (map makers) select what information to include and what information to leave out. In doing so they are guided by the mapping standards set out by the International Orienteering Federation (IOF).
Classification
Classification is the grouping of things into categories, or classes. By grouping attributes into a few discernible classes, new visual patterns in the data can emerge and the map becomes more legible. For example linear byways are categorised as: major and minor roads, vehicle tracks , footpaths, bush tracks, indistinct bush tracks. Or, in a forested area: open and runable; undergrowth walk; or undergrowth fight. Etc. There are many kinds of data classification used on orienteering maps; these are set out clearly in the IOF standards documents. Different patterns emerge depending upon how many classes the cartographer chooses to visualise. One must be critical when looking at maps because changing the map classification can change what appears to be true.
Simplification
Cartographers also need to simplify the features on a map beyond the tasks of feature type selection and feature classification in order to make a map more intelligible. This includes choosing to delete, smooth, typify, and aggregate entities within feature types. A map is not a photograph or picture. If the mapper tries to include “everything” the map would be rendered illegible. Map makers must delete / leave out in order to better serve the purpose of the map.
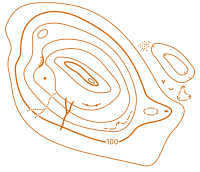
Smoothing
Smoothing is the act of eliminating unnecessary elements in the geometry of features, such as superfluous details of an area’s isolines / contours, or including all point features in an area where the selection of only the most prominent would improve legibility for the orienteering user
Exaggeration
Deliberate exaggeration of map features is often performed in order to allow certain features to be seen clearly by the orienteer. For instance, contour features may be exaggerated to make them clearer to the orienteer user.
Symbolization
In the process of creating a map, the cartographer symbolises the selected features on a map. These features can be symbolised in visually realistic ways, such as a stream depicted by a winding blue line. But many depictions are much more abstract, such as a circle representing a light pole or a blue star representing a water feature. Map symbols are constructed from more primitive graphic variables, the elements that make up symbols. Below, we provide a brief overview of these core graphic variables; then we focus on how colour in particular is used (or should be used).
Graphic Variables
The visual appearance of all maps starts from a very small set of display primitives from which all those variations can be constructed. We call these primitives “graphic variables” because each represents a “graphic” (visible) feature of a map symbol that can be “varied.” While different cartographers have identified a slightly different set of primitives, most agree that there are somewhere between 7 and 12 of them from which all maps symbolisation can be constructed. The most commonly cited primitives that can be varied for map symbols are: location, size, shape, orientation, texture, and three components of colour – colour hue (red, green, blue, etc.), colour lightness (how light or dark the colour is), colour saturation (how pure the colour hue is). By convention, each of these "graphic variables" is used to represent particular categories of data variation. For the orienteering mapper the IOF standards set out in clear detail the structure of the “graphic variables” that are to be used on orienteering maps.
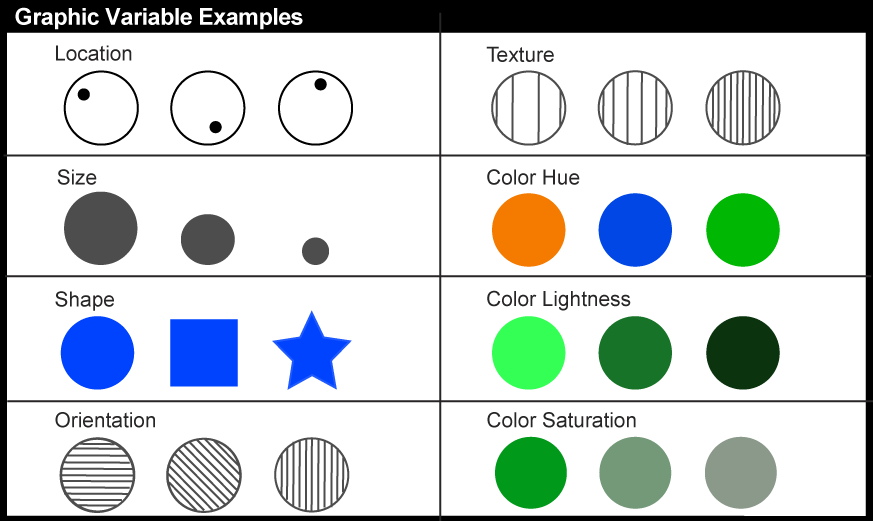
Colour Schemes
As illustrated, three of the graphic variables are components of colour. Well-designed maps use variations in the three colour variables in ways that reflect the kinds of variations in the underlying data they represent. The IOF standards set out colour variations to depict runability, openness, ground cover, etc. Recognising the latter is particularly important for the orienteer user.
The IOF is aware that colour schemes are of concern to orienteer users who have colour deficiency (about 8% of the population; difficulty distinguishing red from green is the most common). This problem is under constant review. The present IOF standards have evolved to address this issue.
Reference sources:
PennState College of Earth and Mineral Sciences [https://www.e-education.psu.edu/geog160/node/1882].
MapTrove, Canada [https://www.maptrove.ca/info/maps-for-learning-education/essential-elements-of-a-map].
IOF Mapping Standards
[Figure: The Cartographic Process. Credit: Jennifer M. Smith, © The Pennsylvania State University; Redesigned after lecture slide provided by Barbara Buttenfield, University of Colorado, Department of Geography.]
▲
Return to "A Resource for Mappers" Home Page